| > | with(plots):
with(plottools): |
Let's look at a position vector r(t):
| > | r:=t->[8*cos(t),8*sin(t),t]: |
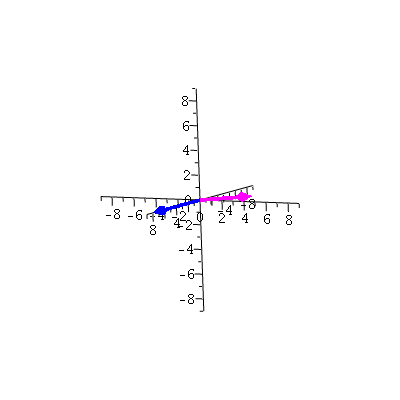
This is a vector from the origin to the point r(t): at t=0 and t=Pi/3,
| > | display3d(arrow([0,0,0],r(0),0.3,0.8,0.2,cylindrical_arrow,color=blue),arrow([0,0,0],r(Pi/3),0.3,0.8,0.2,cylindrical_arrow,color="Magenta"),axes=normal,view=[-9..9,-9..9,-9..9]); |
|
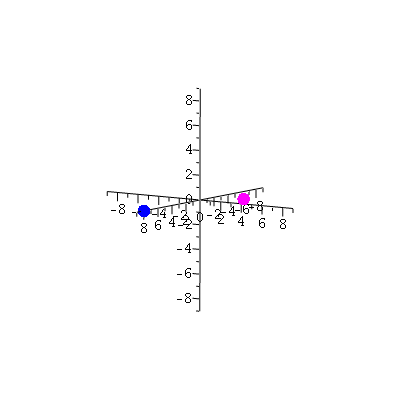
Let's put a point at the end of the vector, which lets us visualize the position without the vector:
| > | display3d(sphere(r(0),0.5,color=blue,style=patchnogrid),sphere(r(Pi/3),0.5,color="Magenta",style=patchnogrid),axes=normal,view=[-9..9,-9..9,-9..9]); |
 |
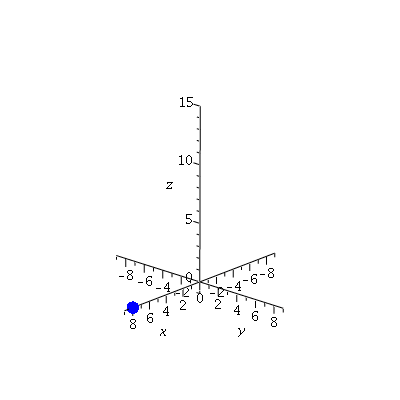
...and then we can see how the sphere moves with time...
| > | nframes:=20:
curve2:=display([sphere(r(0),0.5,color=blue,style=patchnogrid), seq(spacecurve(r(t),t=0..4*Pi*i/nframes,color=coral,thickness=3), i=1..nframes)],insequence=true): pt2:=display([seq(sphere(r(4*Pi*i/nframes),0.5,color=blue,style=patchnogrid),i=0..nframes)],insequence=true): display({curve2,pt2},axes=normal,scaling=constrained,labels=[`x`,`y`,`z`],view=[-9..9,-9..9,-1..15]); |
 |