| > | with(plottools):
with(plots): |
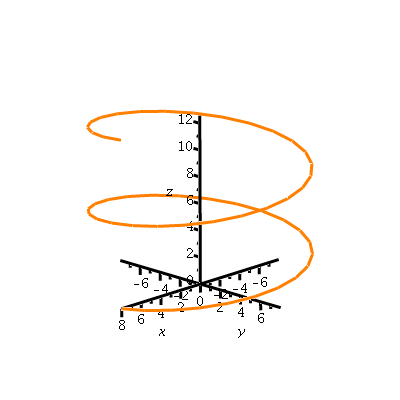
We consider the helix given by
| > | r:=t->[8*cos(t),8*sin(t),t]: |
which is
| > | hel:=spacecurve(r(t),t=0..4*Pi,axes=normal,scaling=constrained,labels=['x','y','z'],thickness=3,color=coral):
hel; |
 |
A vector pointing between two points of the curve, say, t=9 Pi/4 and t=9 Pi/4 + 0.5, is what we expect; if we take this over the change in time, we have the average rate of change, which (because delta t < 1) is longer than the original vector
| > | p1:=sphere(r(9*Pi/4),0.35,color=blue,style=patchnogrid):
p2:=sphere(r(9*Pi/4+.5),0.35,color=red,style=patchnogrid): v1:=arrow(r(9*Pi/4),(r(9*Pi/4+.5)-r(9*Pi/4)),color=blue, width=[0.4,relative=false],head_length=[2,relative=false]): v2:=arrow(r(9*Pi/4),(r(9*Pi/4+.5)-r(9*Pi/4))/.5,color=blue, width=[0.25,relative=false],head_length=[2,relative=false]): display([display(hel,p1,p2,v1), display(hel,p1,p2,v2)],insequence=true); |
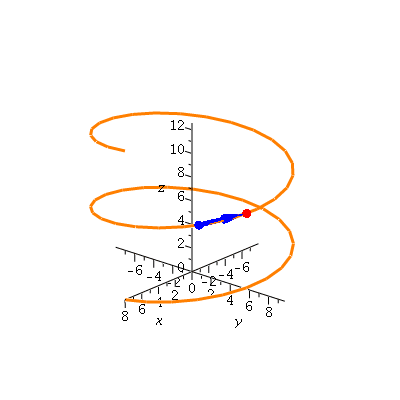 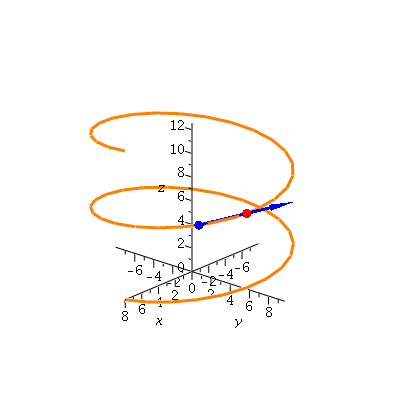 |
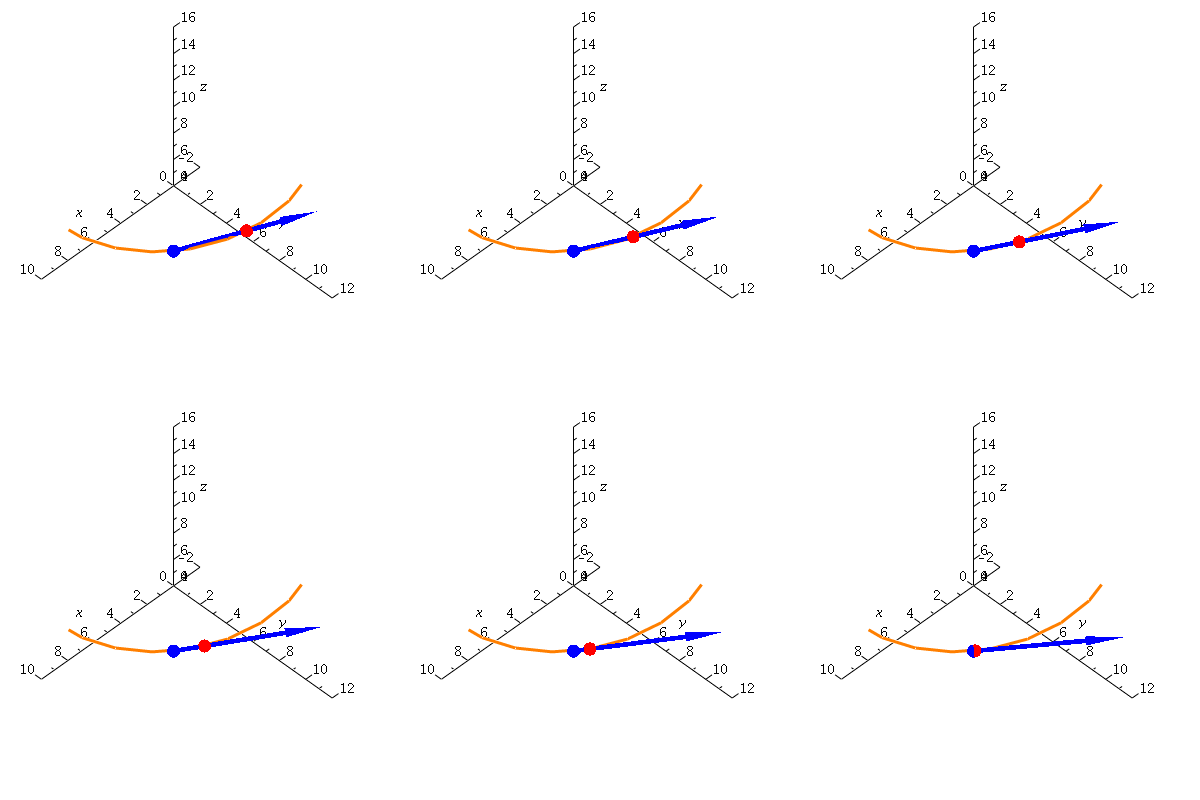
Now, what happens as delta t goes to zero?
| > | nfr:=5: sdist:=0.5: inc:=sdist/nfr: sdist:=sdist+0.01:
helseq:=display([seq(hel,i=0..nfr)],insequence=true): ptseq:=display([seq(p1,i=0..nfr)],insequence=true): derptseq:=display([seq(sphere(r(9*Pi/4+sdist-i*inc),0.35,color=red,style=patchnogrid),i=0..nfr)],insequence=true): derptseq:=display([seq(sphere(r(9*Pi/4+sdist-i*inc),0.35,color=red,style=patchnogrid),i=0..nfr)],insequence=true): vecptseq:=display([seq(arrow(r(9*Pi/4),(r(9*Pi/4+sdist-i*inc)-r(9*Pi/4)),color=blue,width=[0.25,relative=false],head_length=[2,relative=false]),i=0..nfr)],insequence=true): derseq:=display([seq(arrow(r(9*Pi/4),(r(9*Pi/4+sdist-i*inc)-r(9*Pi/4))/(sdist-i*inc),color=blue,width=[0.25,relative=false],head_length=[2,relative=false]),i=0..nfr)],insequence=true): |
| > | display(helseq,ptseq,derptseq,view=[0..8,0..8,4..12]); |
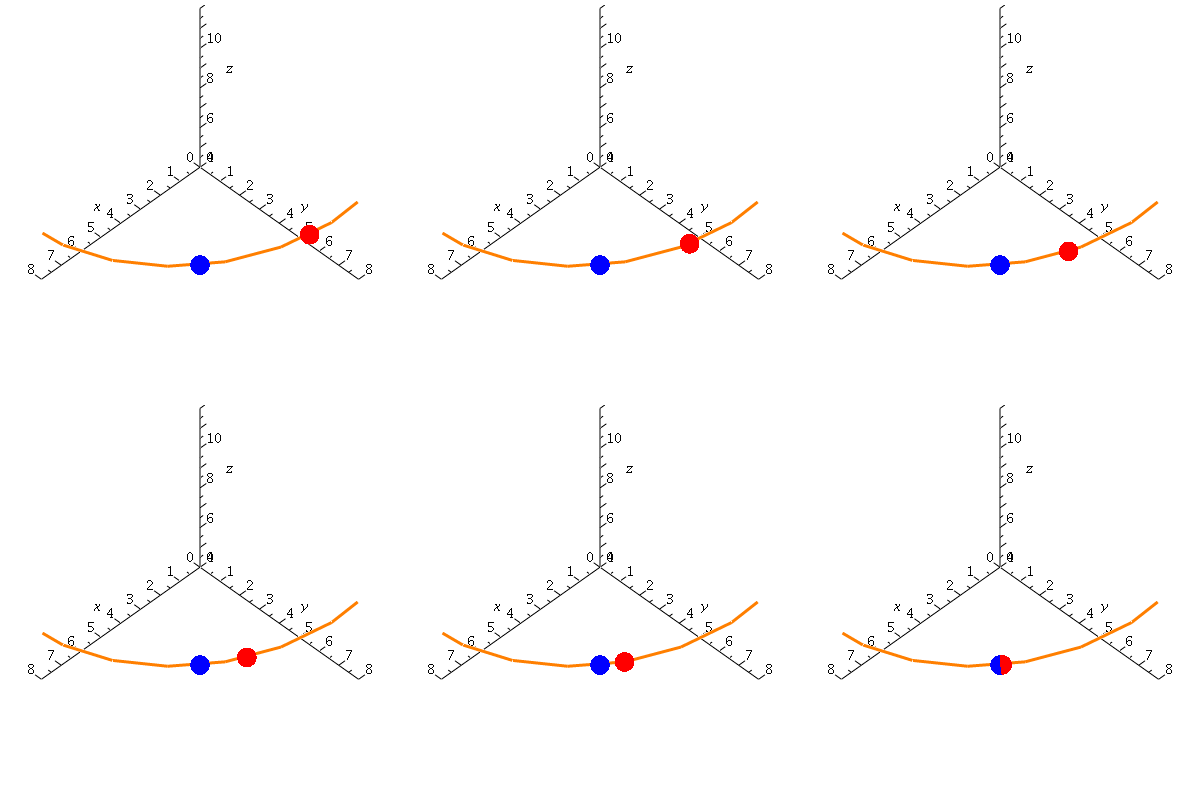 |
Or, with vectors,
| > | display(helseq,ptseq,derptseq,derseq,view=[-2..10,0..12,4..16]); |
 |
| > |